Setting the strategic direction
- Design decisions were being made without enough contact with end users. I pushed for structurally more school visits and user contact — increasing what we called user exposure hours.
- Over the course of a year: 8 school visits I attended personally, team members encouraged to visit schools as well, and structured online conversations — adding up to roughly 70 hours of cumulative user contact.
- The result was a UX vision, told as a story from the teacher's perspective: a future where all current frustrations are resolved. This story was printed and hung in the office, giving the entire team a shared picture of where we were heading.
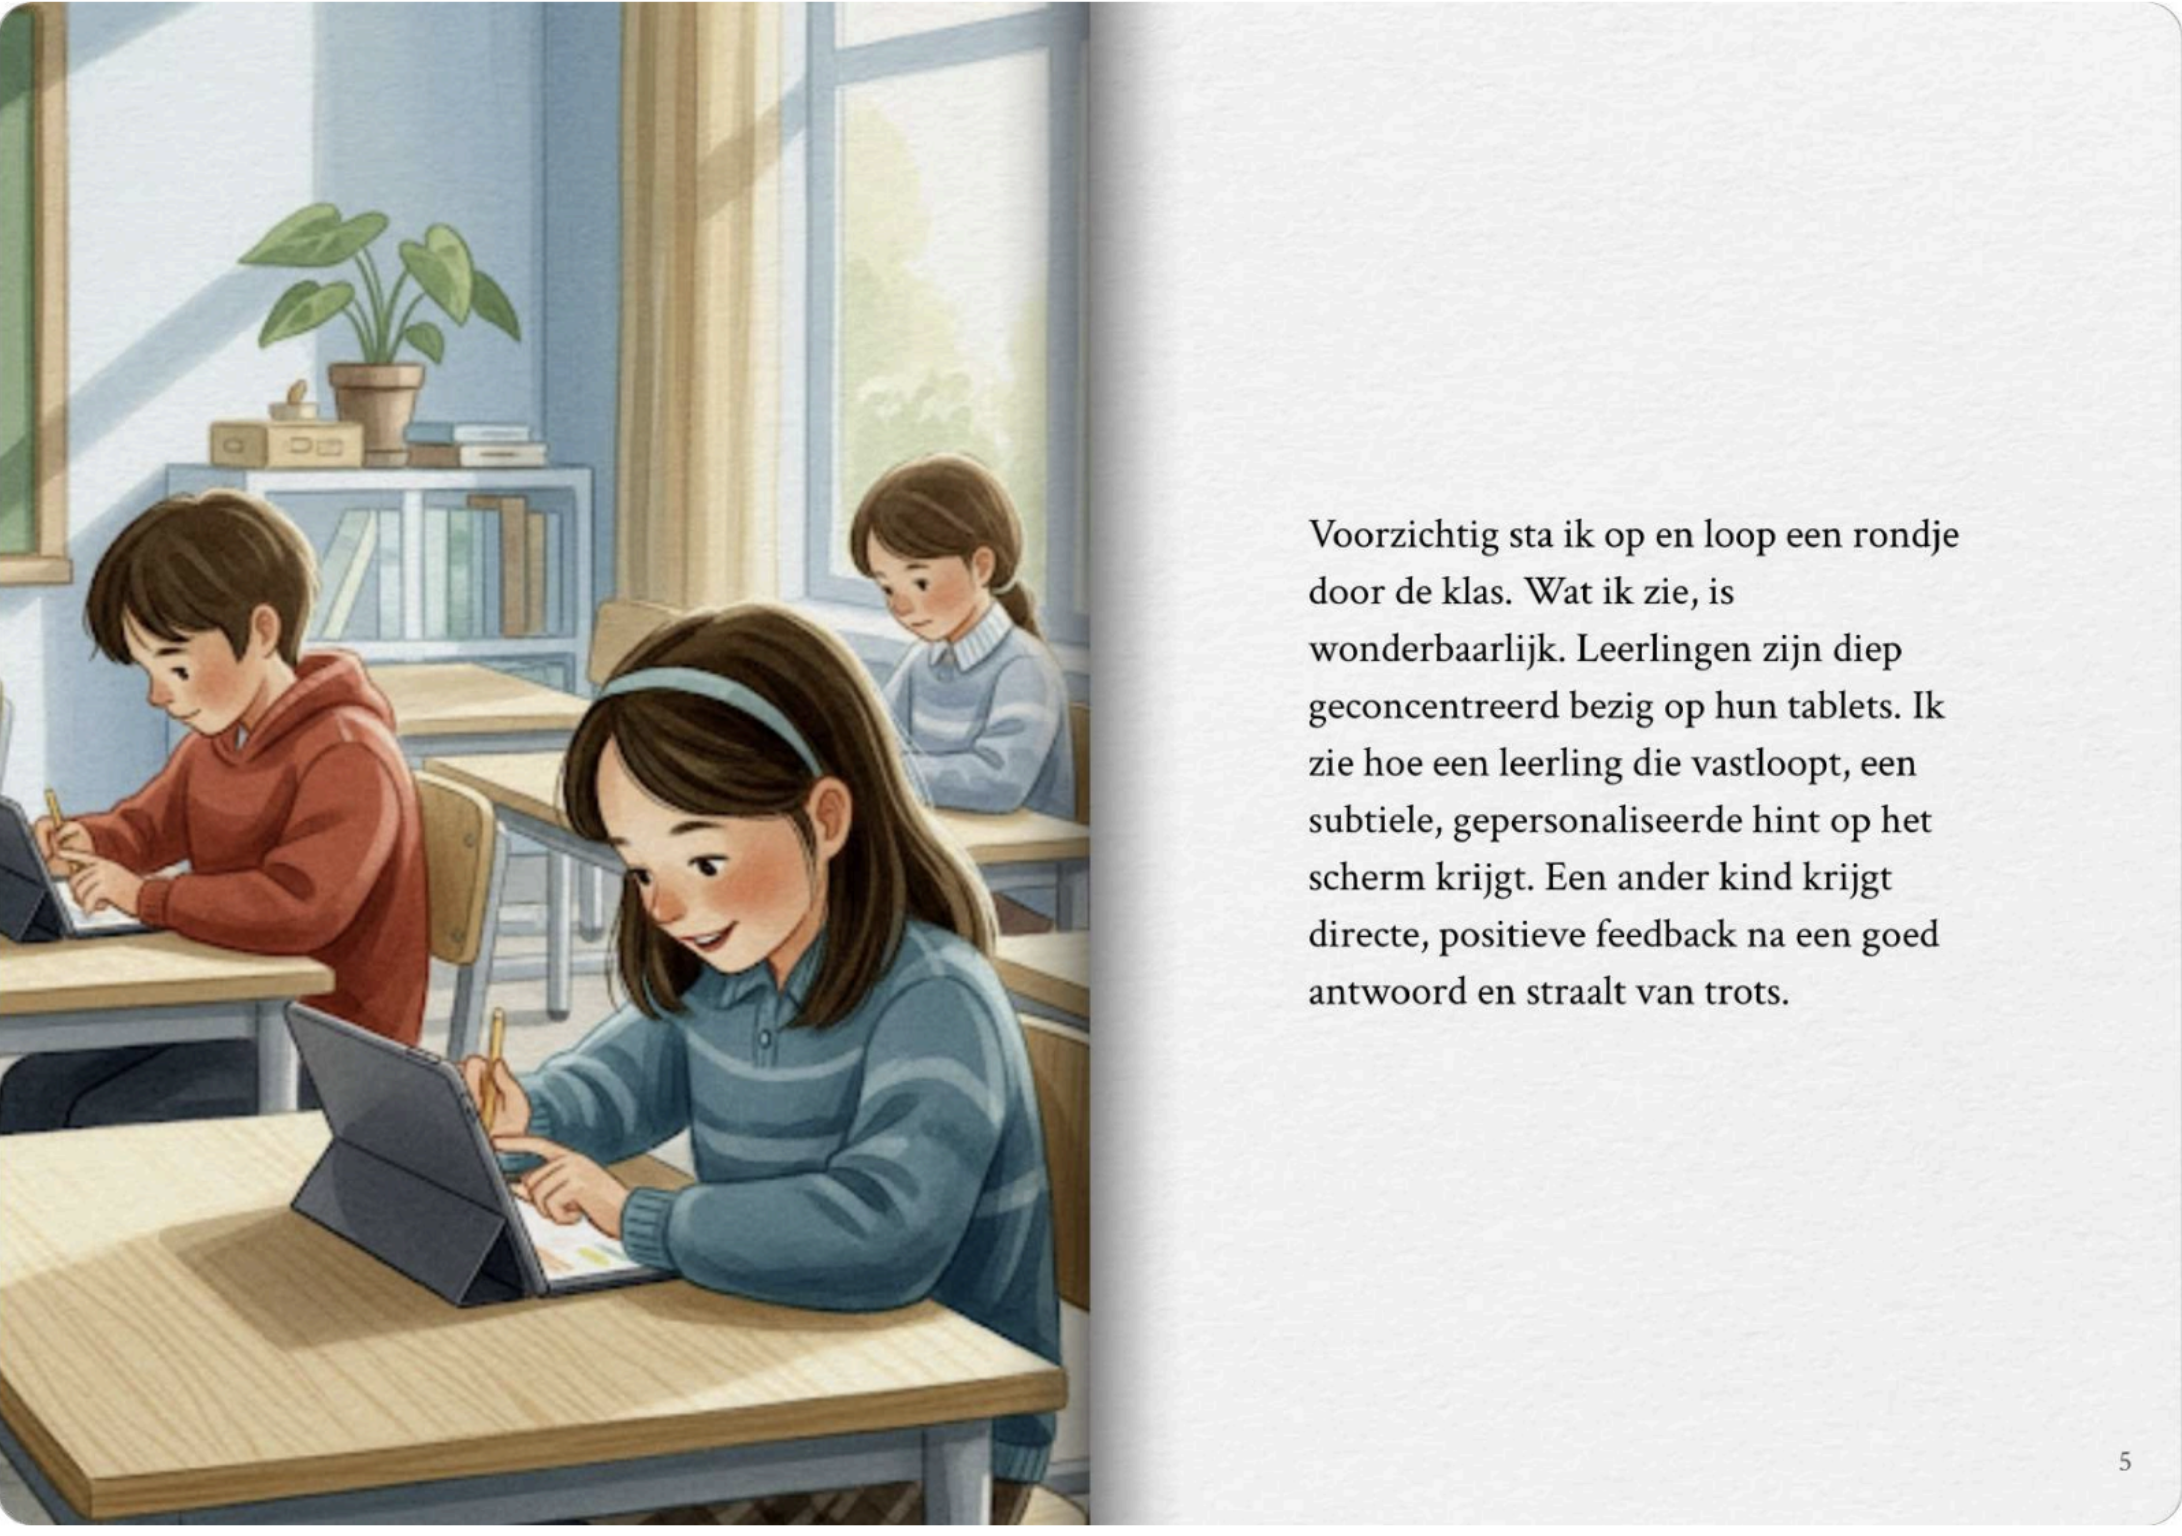
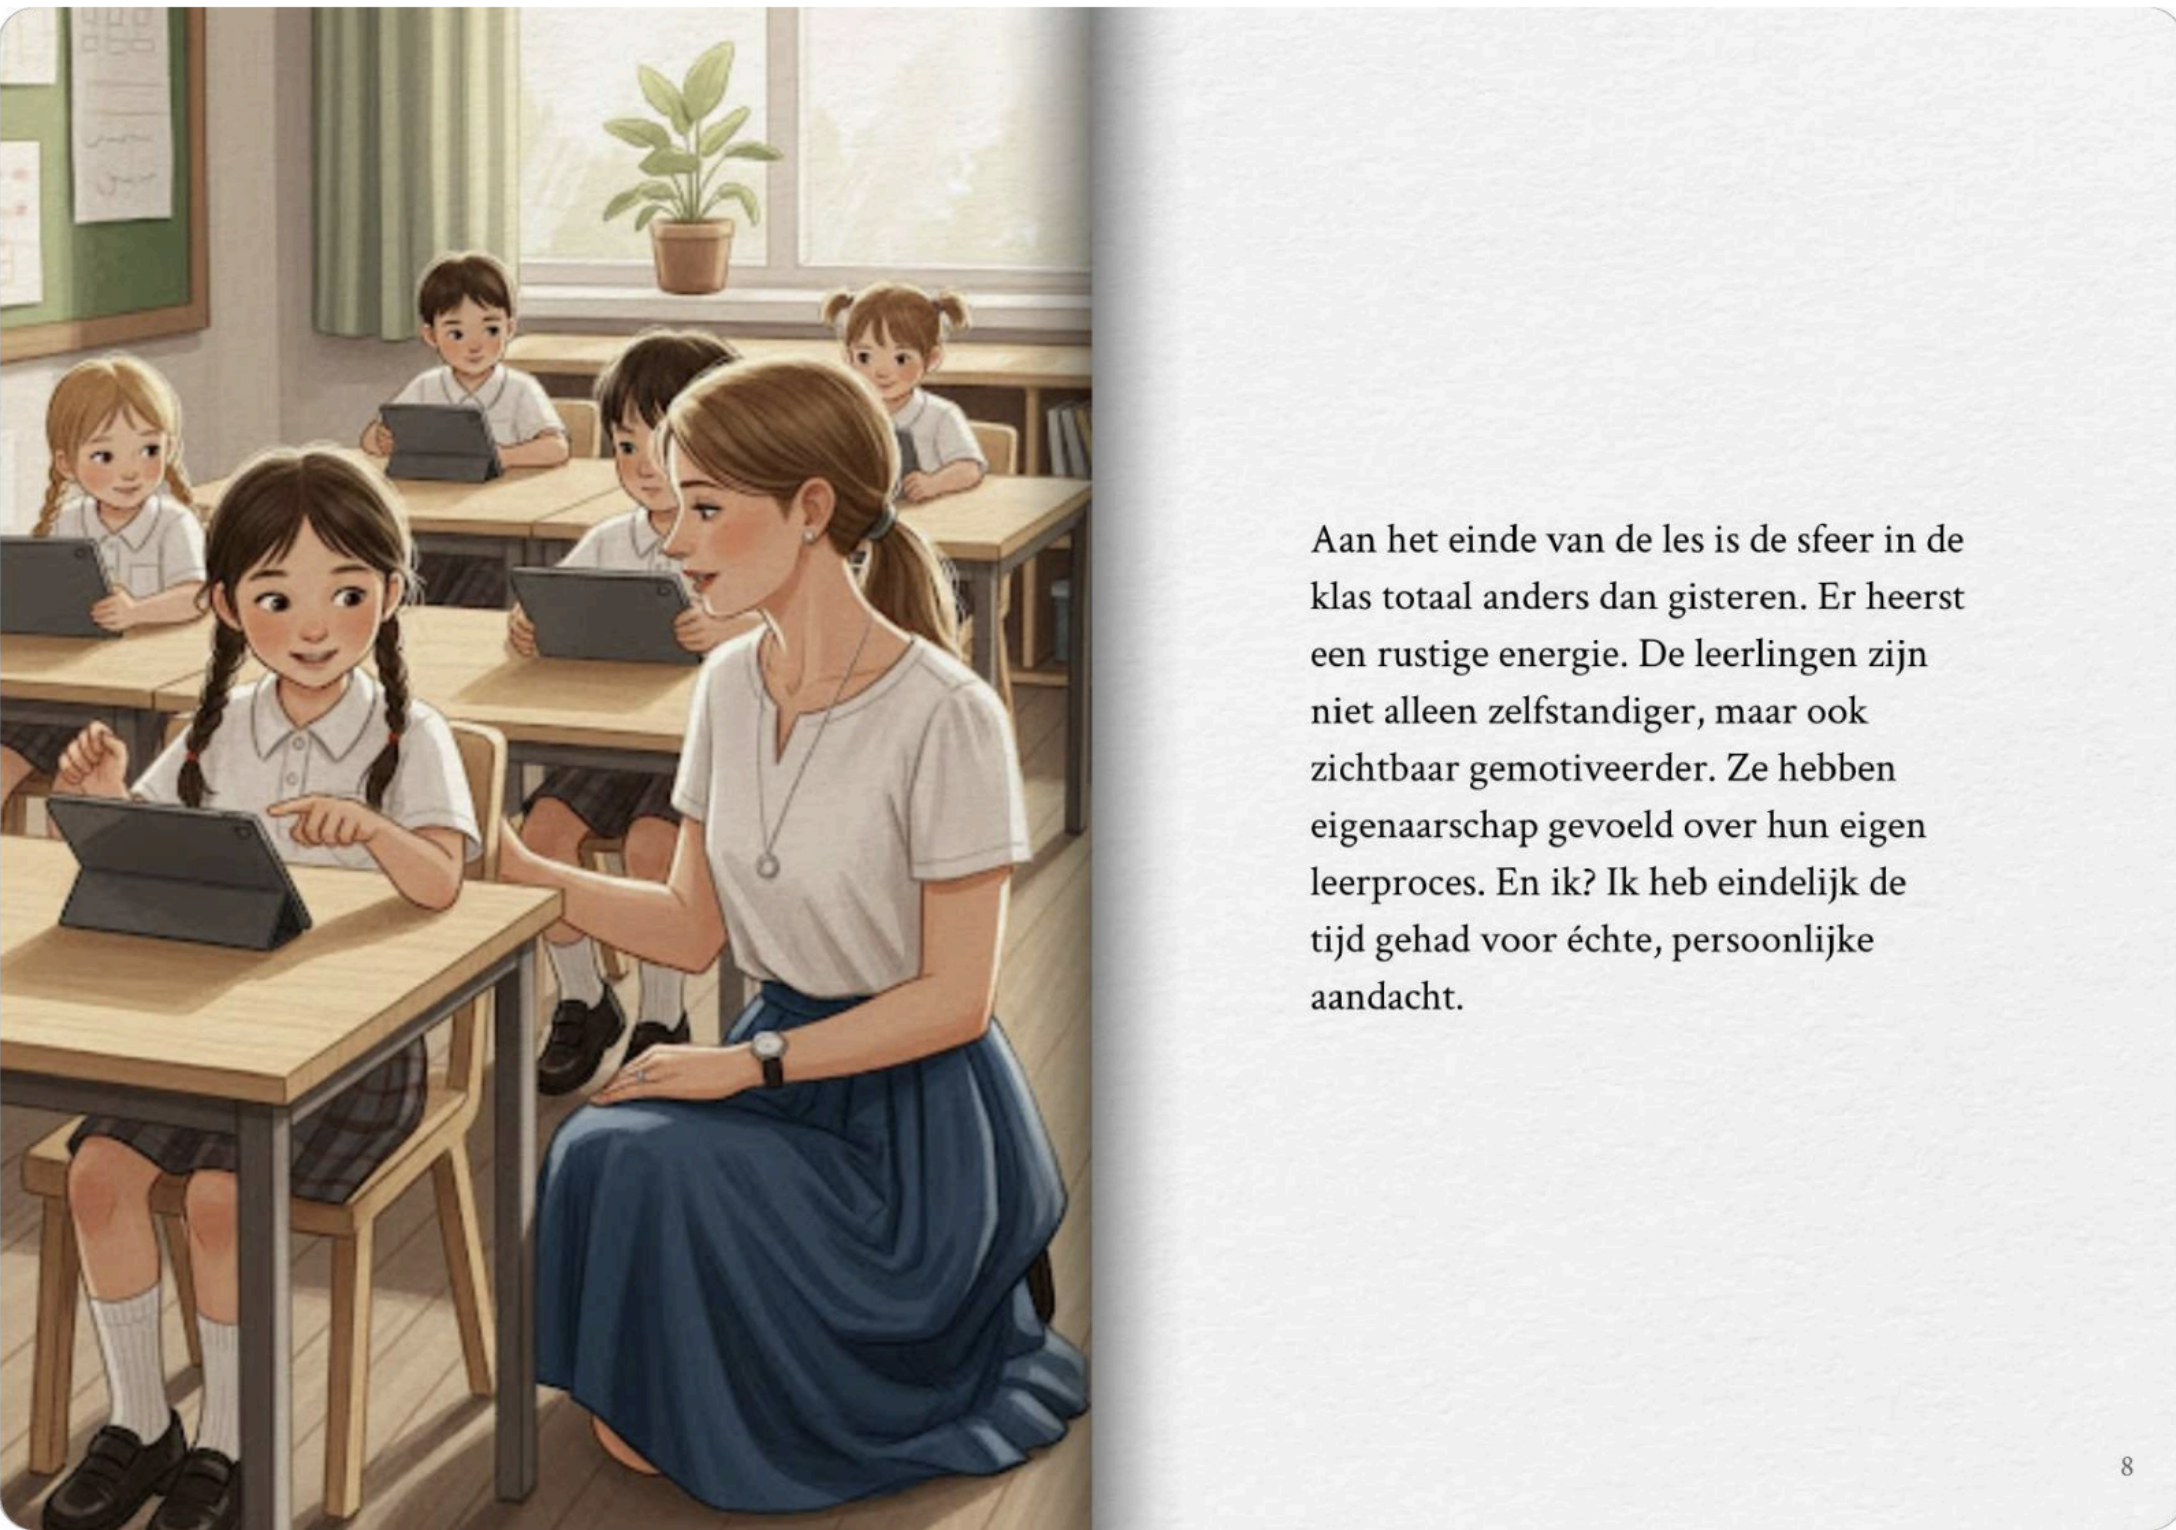
Two spreads from the UX vision story — told from the teacher's perspective, painting a future where students learn independently and teachers have time for personal attention.
The discovery
- The school visits revealed something invisible in our own data: teachers were using all kinds of separate practice software alongside Gynzy, especially for recurring learning goals like multiplication tables and verb spelling.
- Students needed a way to practice that was playful and motivating — independently, at their own level — beyond regular exercises.
- This insight would never have surfaced from feature requests or usage data alone. It's exactly why we do ethnographic research: you have to be in the classroom to see what your data can't show you.
Designing the foundation
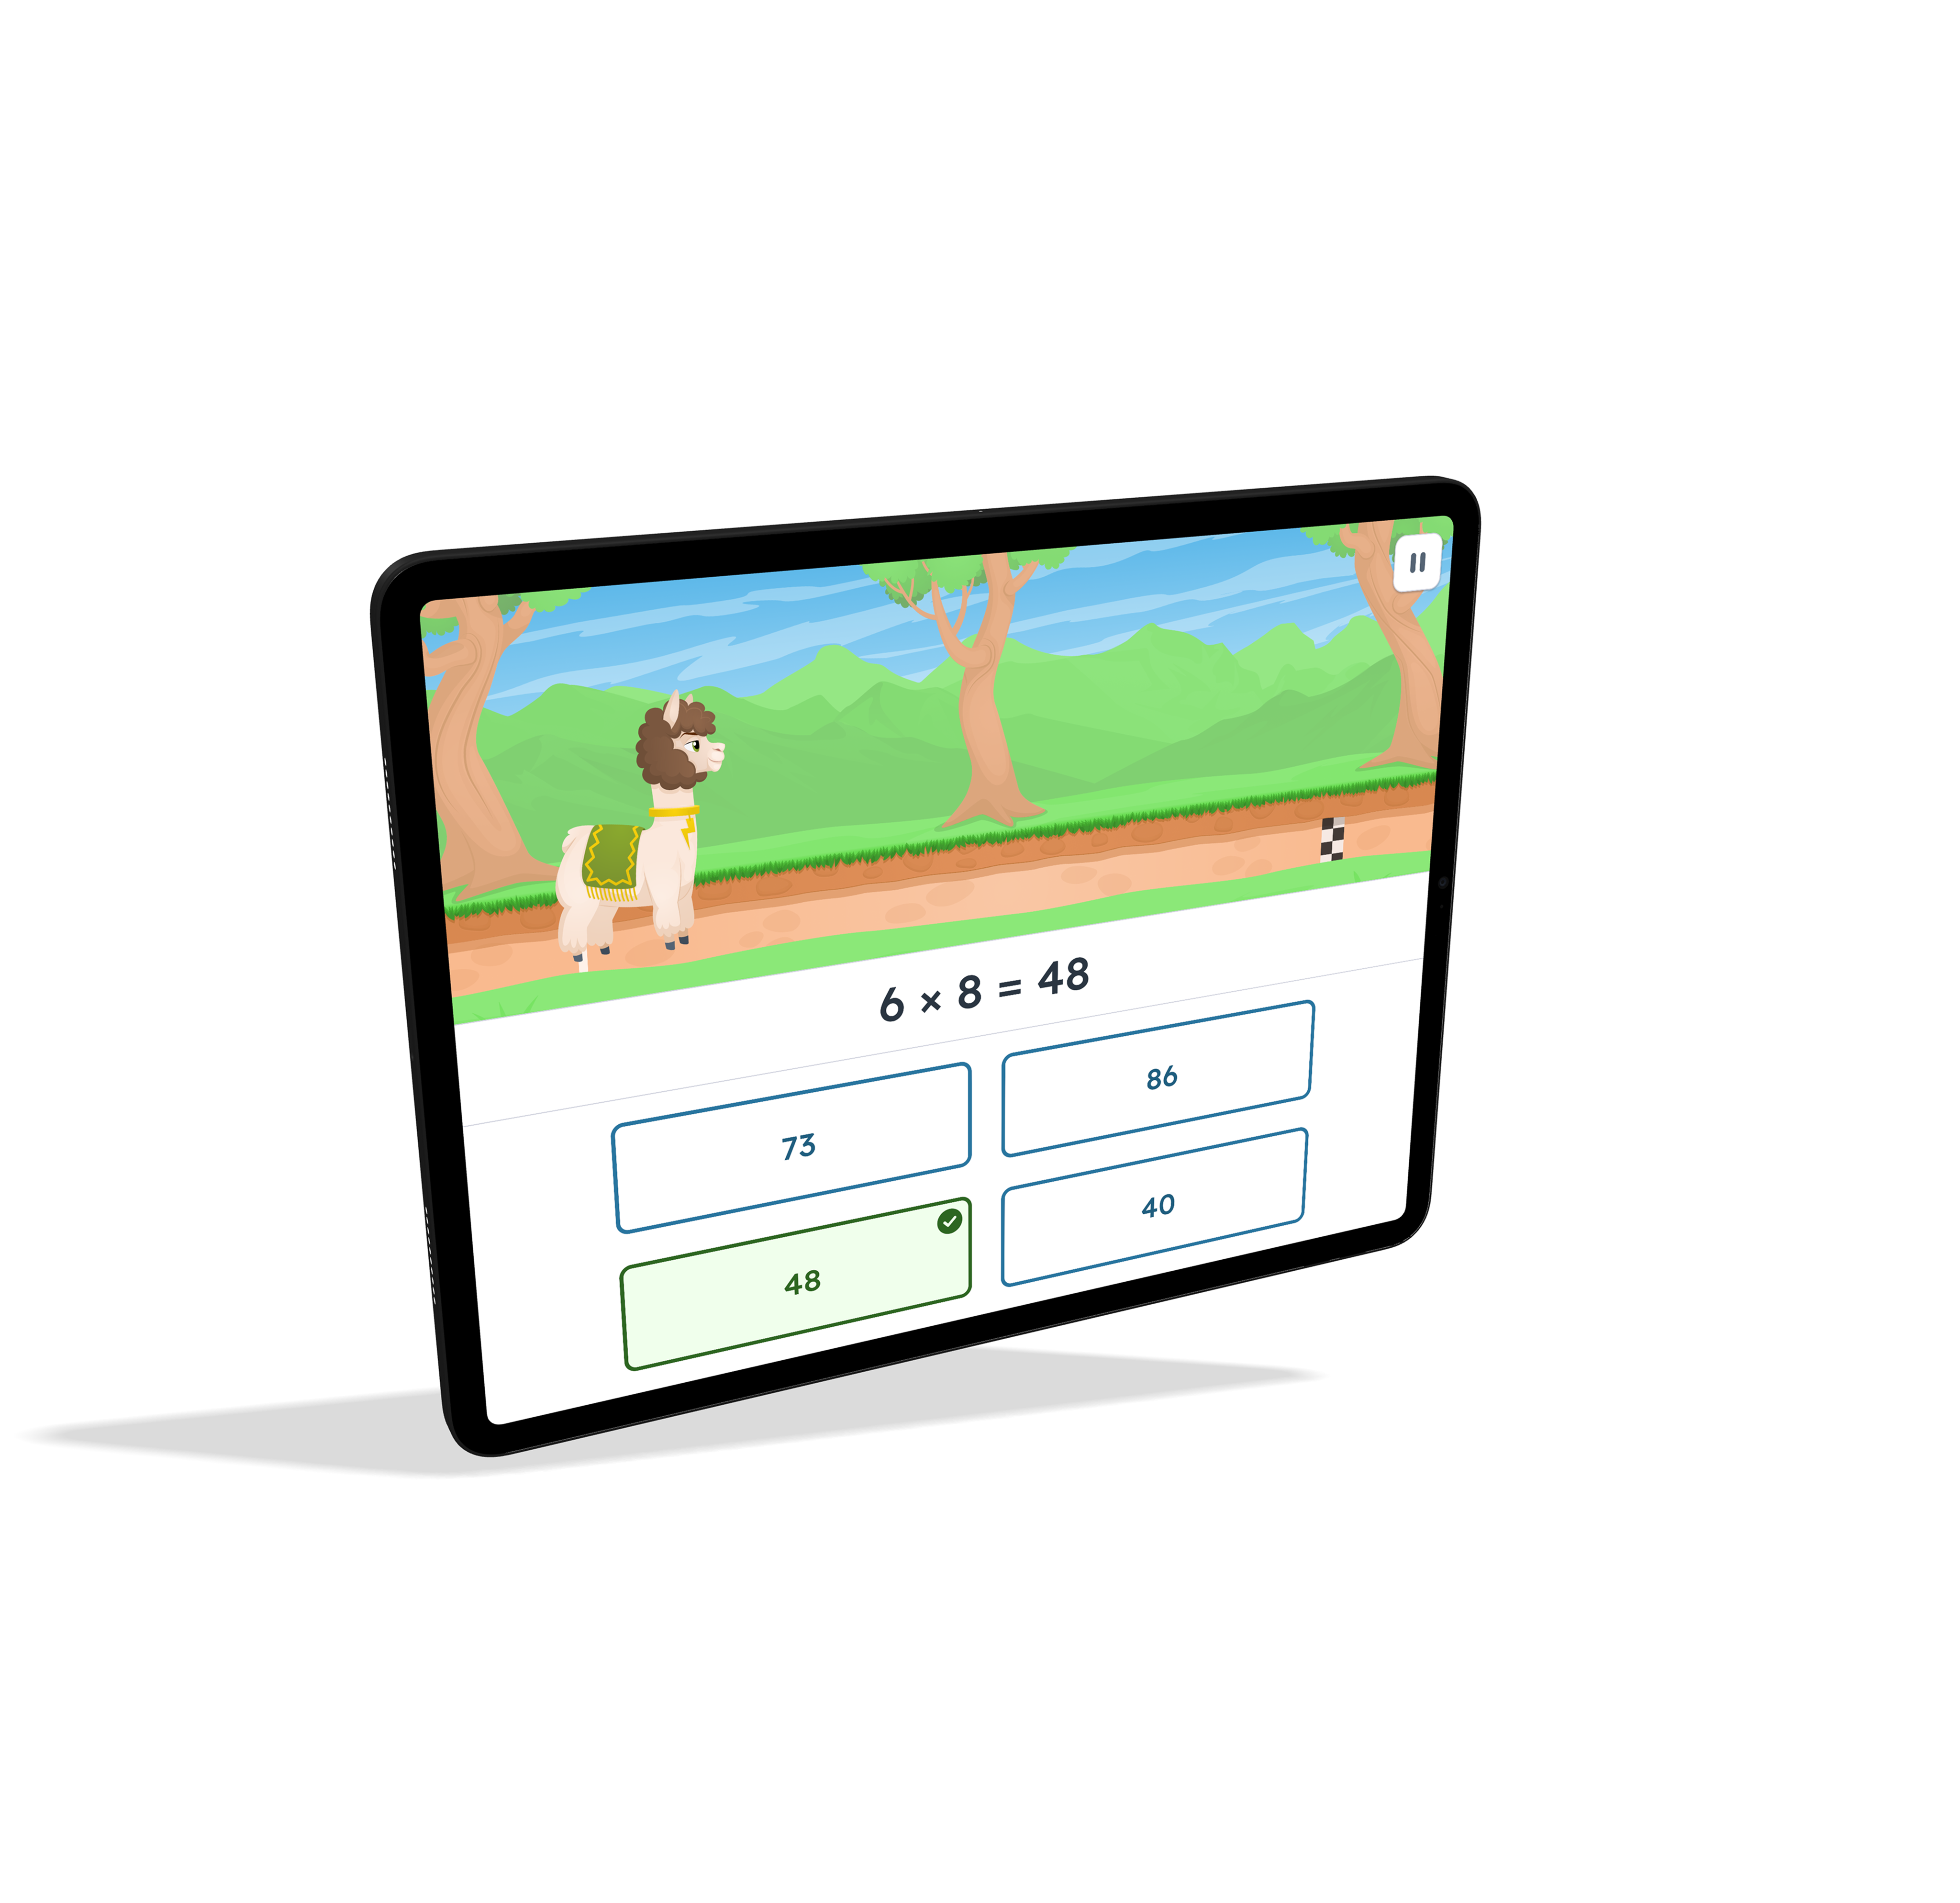
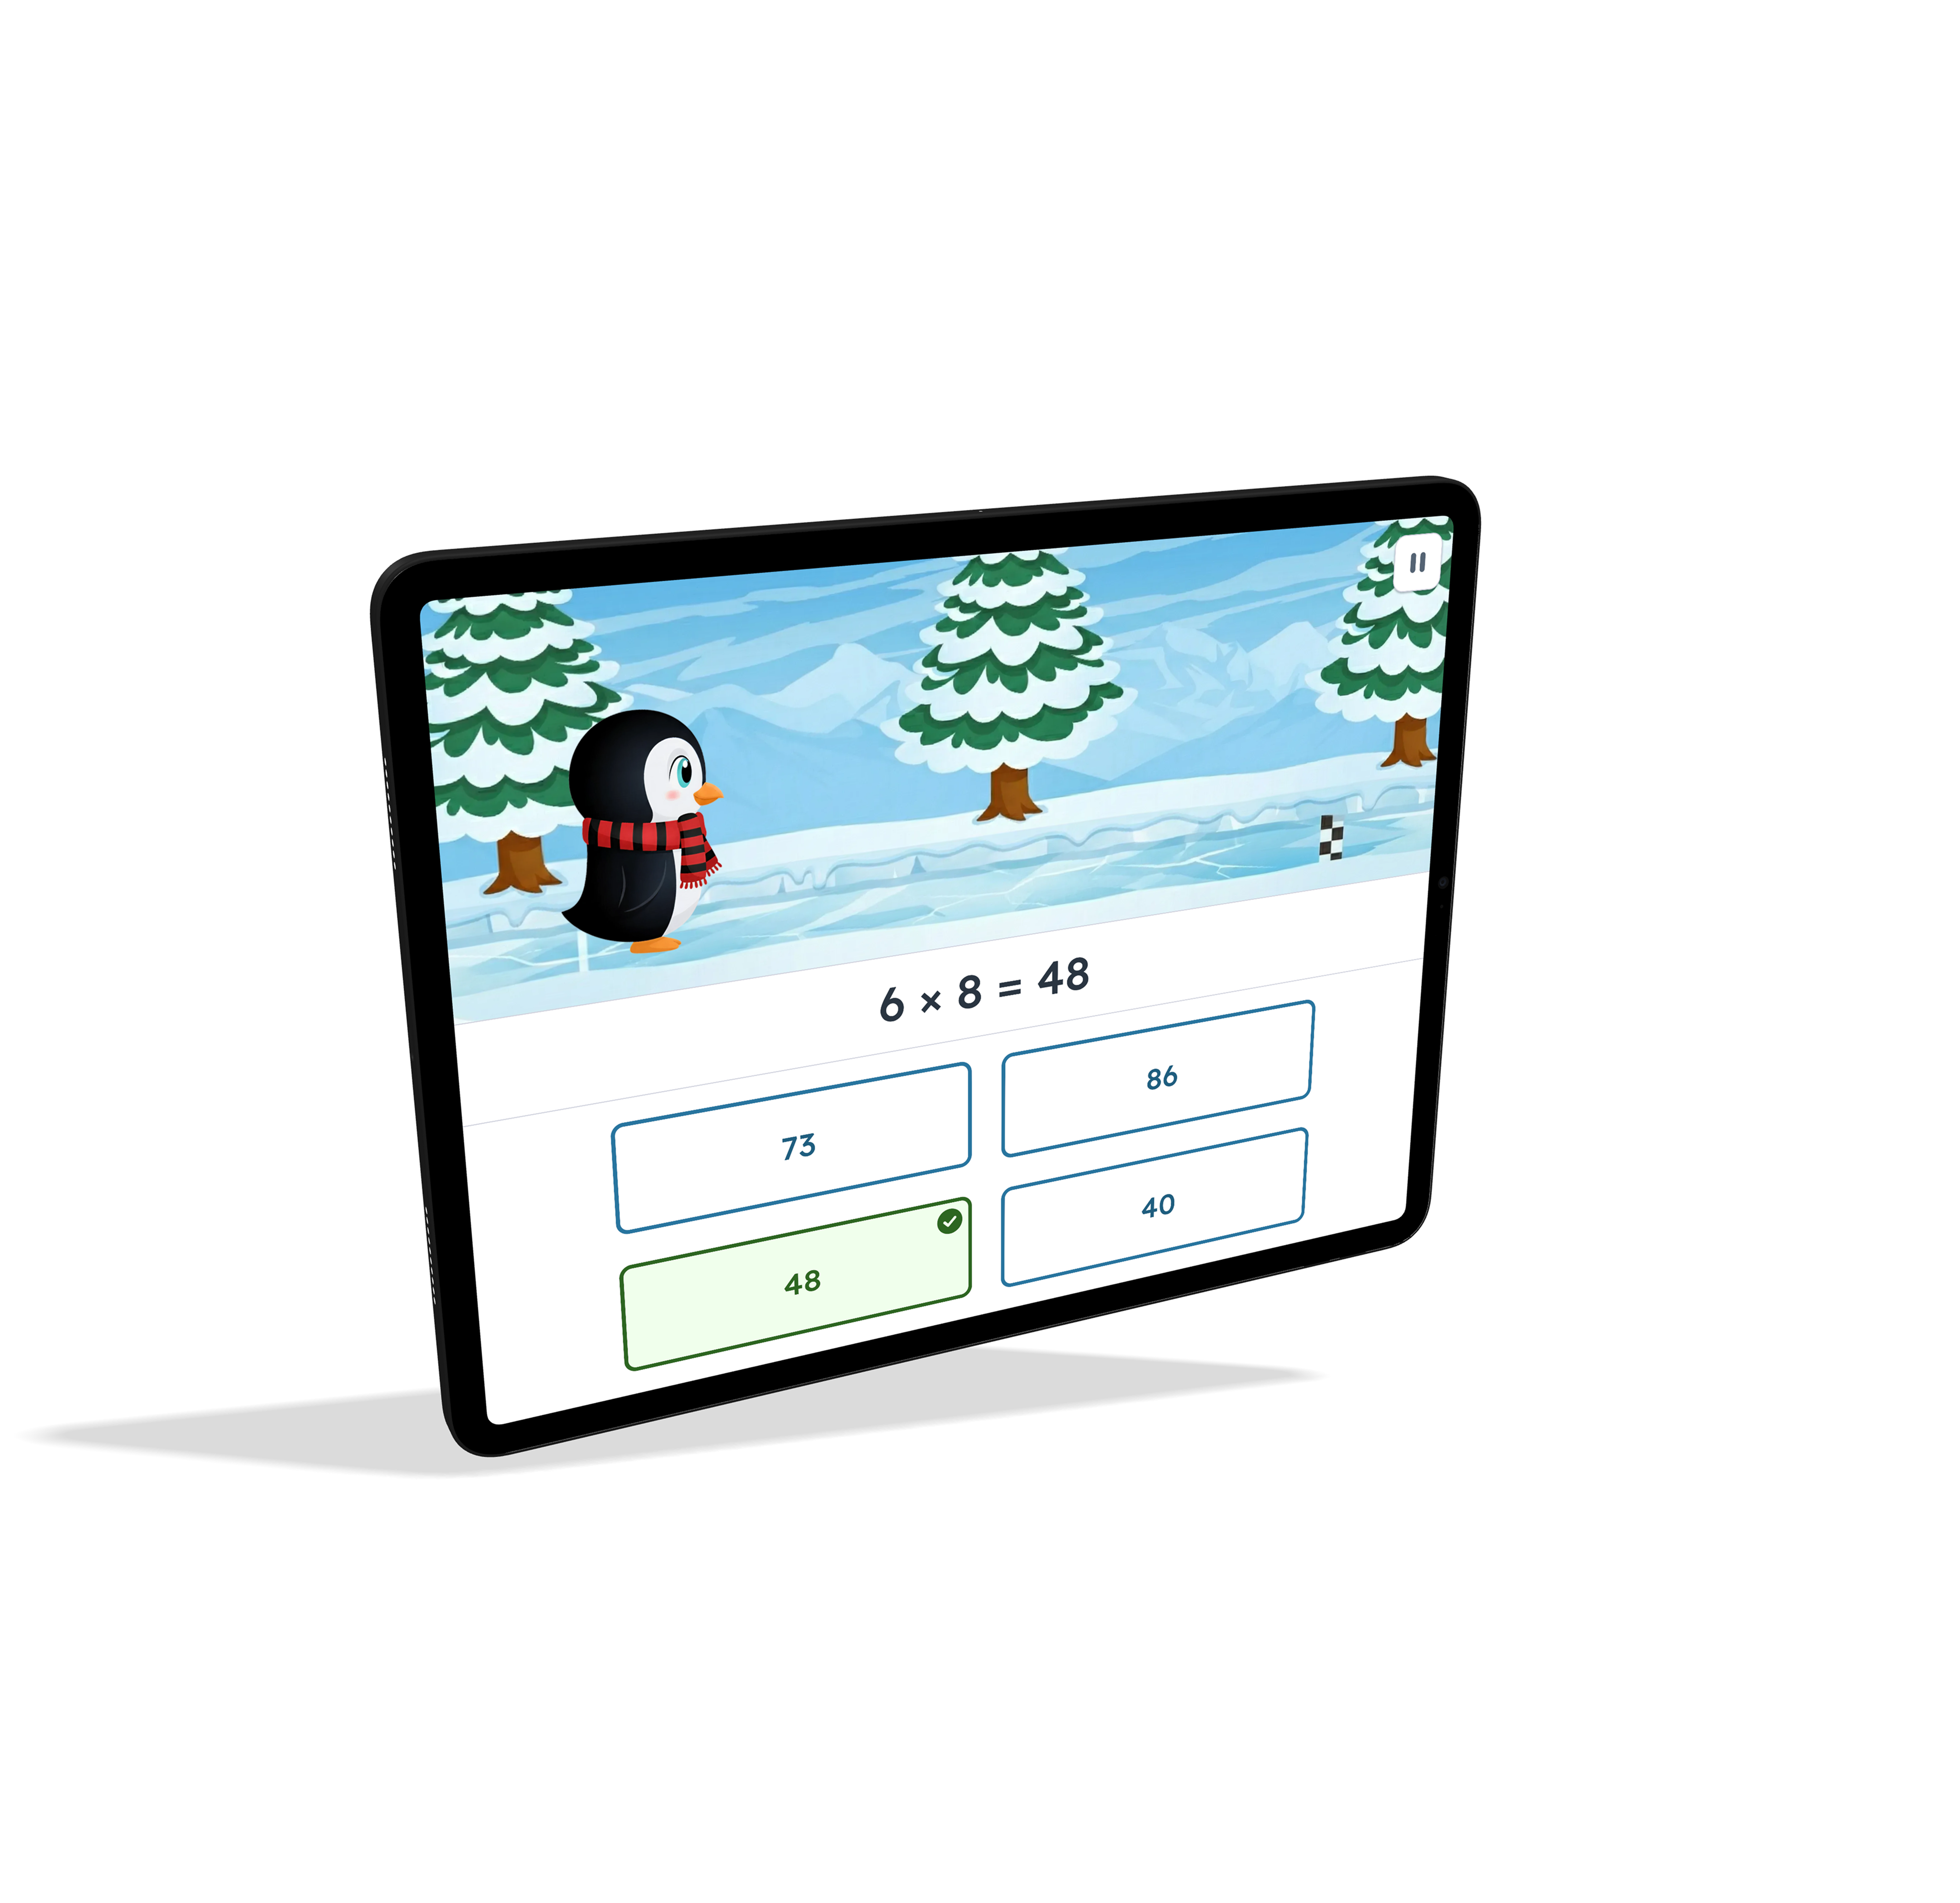
- Gynzy already had a popular classroom feature: the Alpaca Race, where the class splits into two teams and races by answering math facts as fast as possible. A proven concept — and a safe bet to develop further.
- The first step was turning this into a single-player variant, so students could also practice independently. Same proven concept, new format.
- From the start, the architecture was designed to scale along three axes: more interaction types (from multiple choice to fill-in-the-blank and beyond), more learning goals per type, and eventually more subject areas.
- Deliberate scope choices: assigning learning goals to students and showing results to teachers were descoped to ship fast.
- Everything had to be built in Flutter for the student environment — which the design system wasn't prepared for yet. This work ran in parallel with the evolution of the design system.
Alpaca Trainer — Single-player math facts with multiple choice
Scaling up
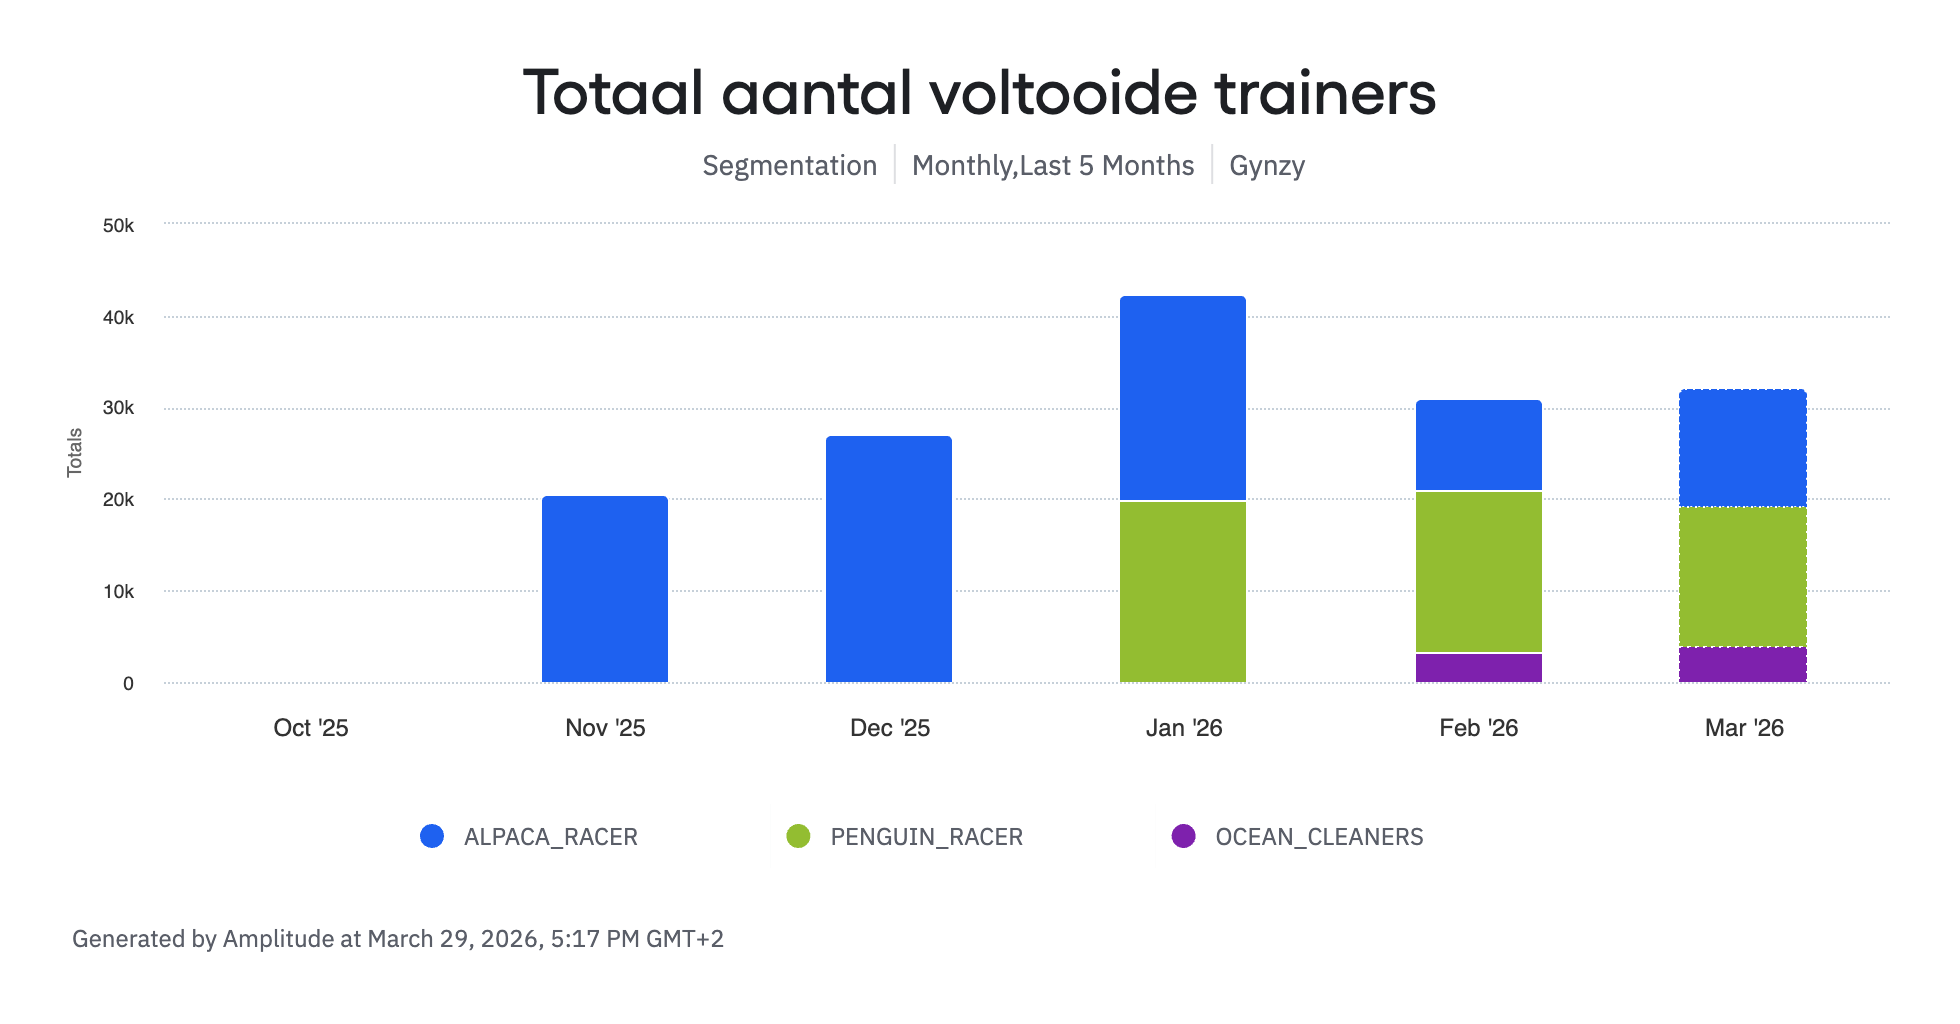
- The scalable architecture proved itself quickly. The Alpaca trainer was followed by a penguin-themed variant with largely AI-generated visuals and sounds — same interaction type, different theme, more variety for students.
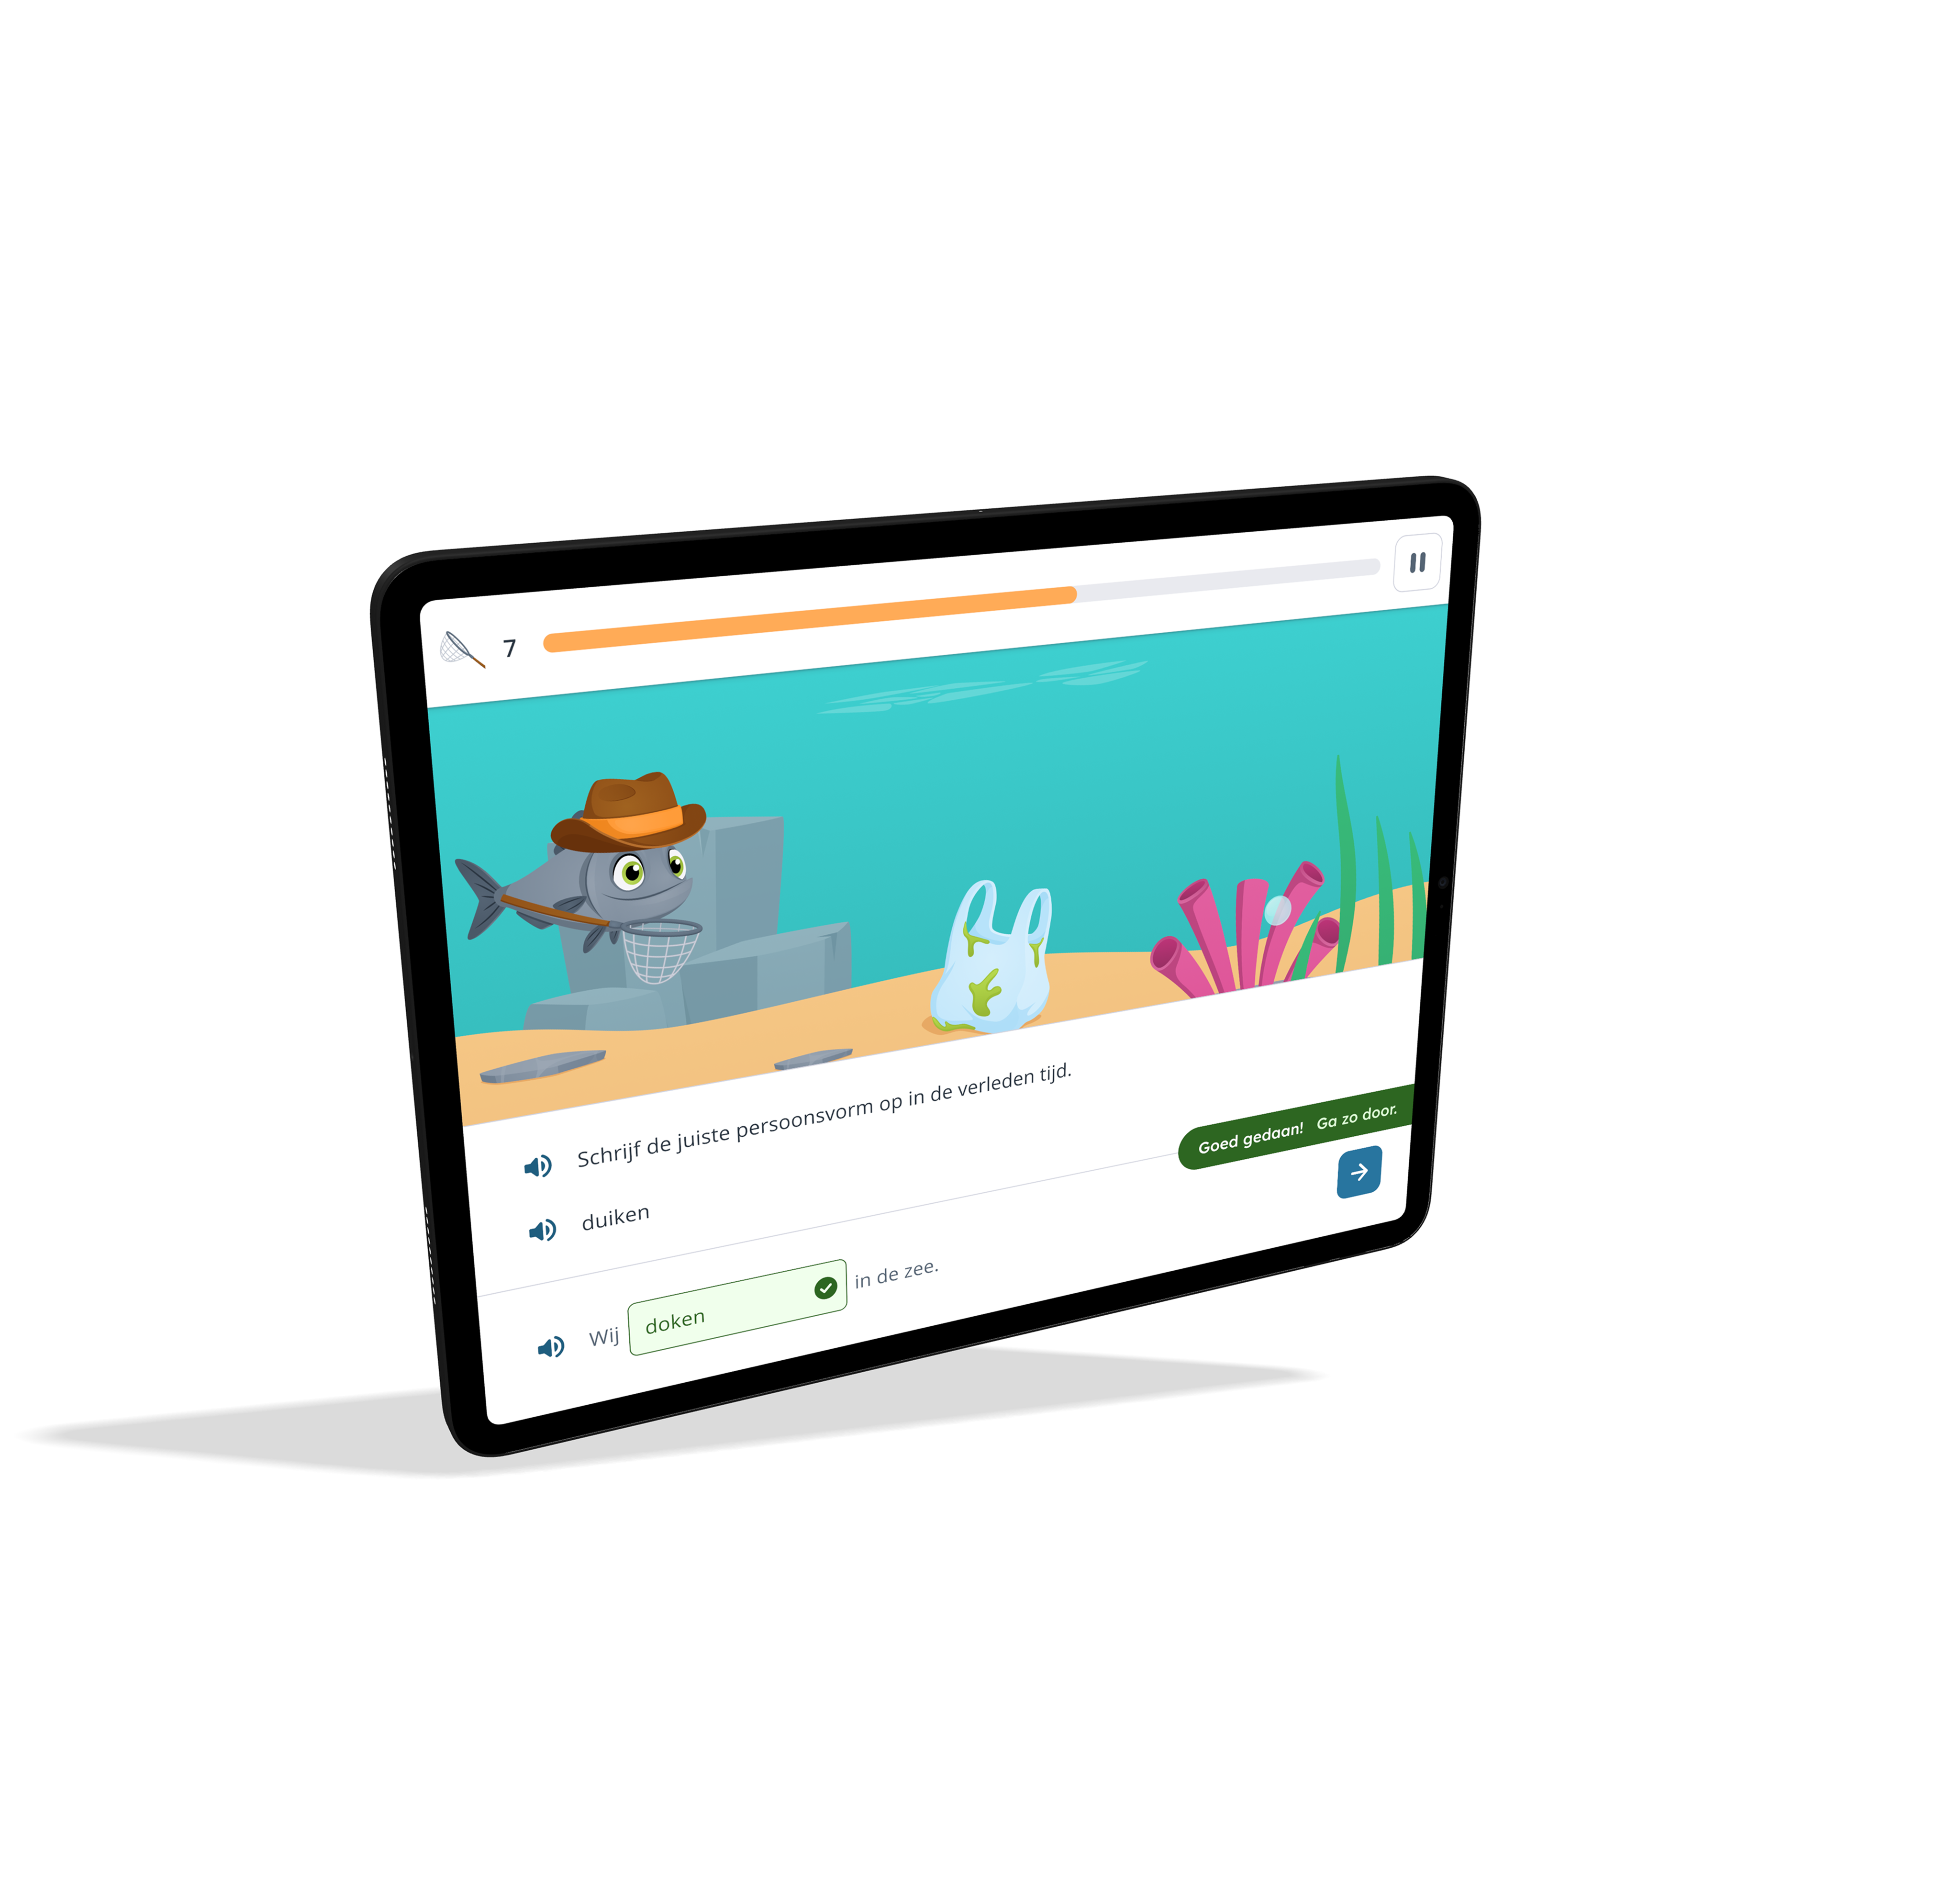
- At the same time, a fundamentally different trainer was developed: the Ocean Cleaners. Instead of automatization (tapping the correct answer as fast as possible via multiple choice), this one is about practicing at your own pace, with fill-in-the-blank answers. First application: verb spelling.
- The Ocean Cleaners introduced new design challenges. The input field had to work on Chromebooks with a physical keyboard and iPads with an on-screen keyboard — leading to a density layer in the design system for adjusting element density per device. Additionally, layouts were designed for narrower screens. Both are ready for implementation.
Penguin Race — AI-generated theme, same interaction type
Ocean Cleaners — Fill-in-the-blank for verb spelling
Results
- Since launch in November 2025, over 130,000 unique students have completed a trainer session.
- In the busiest week, more than 220,000 trainer sessions were completed.
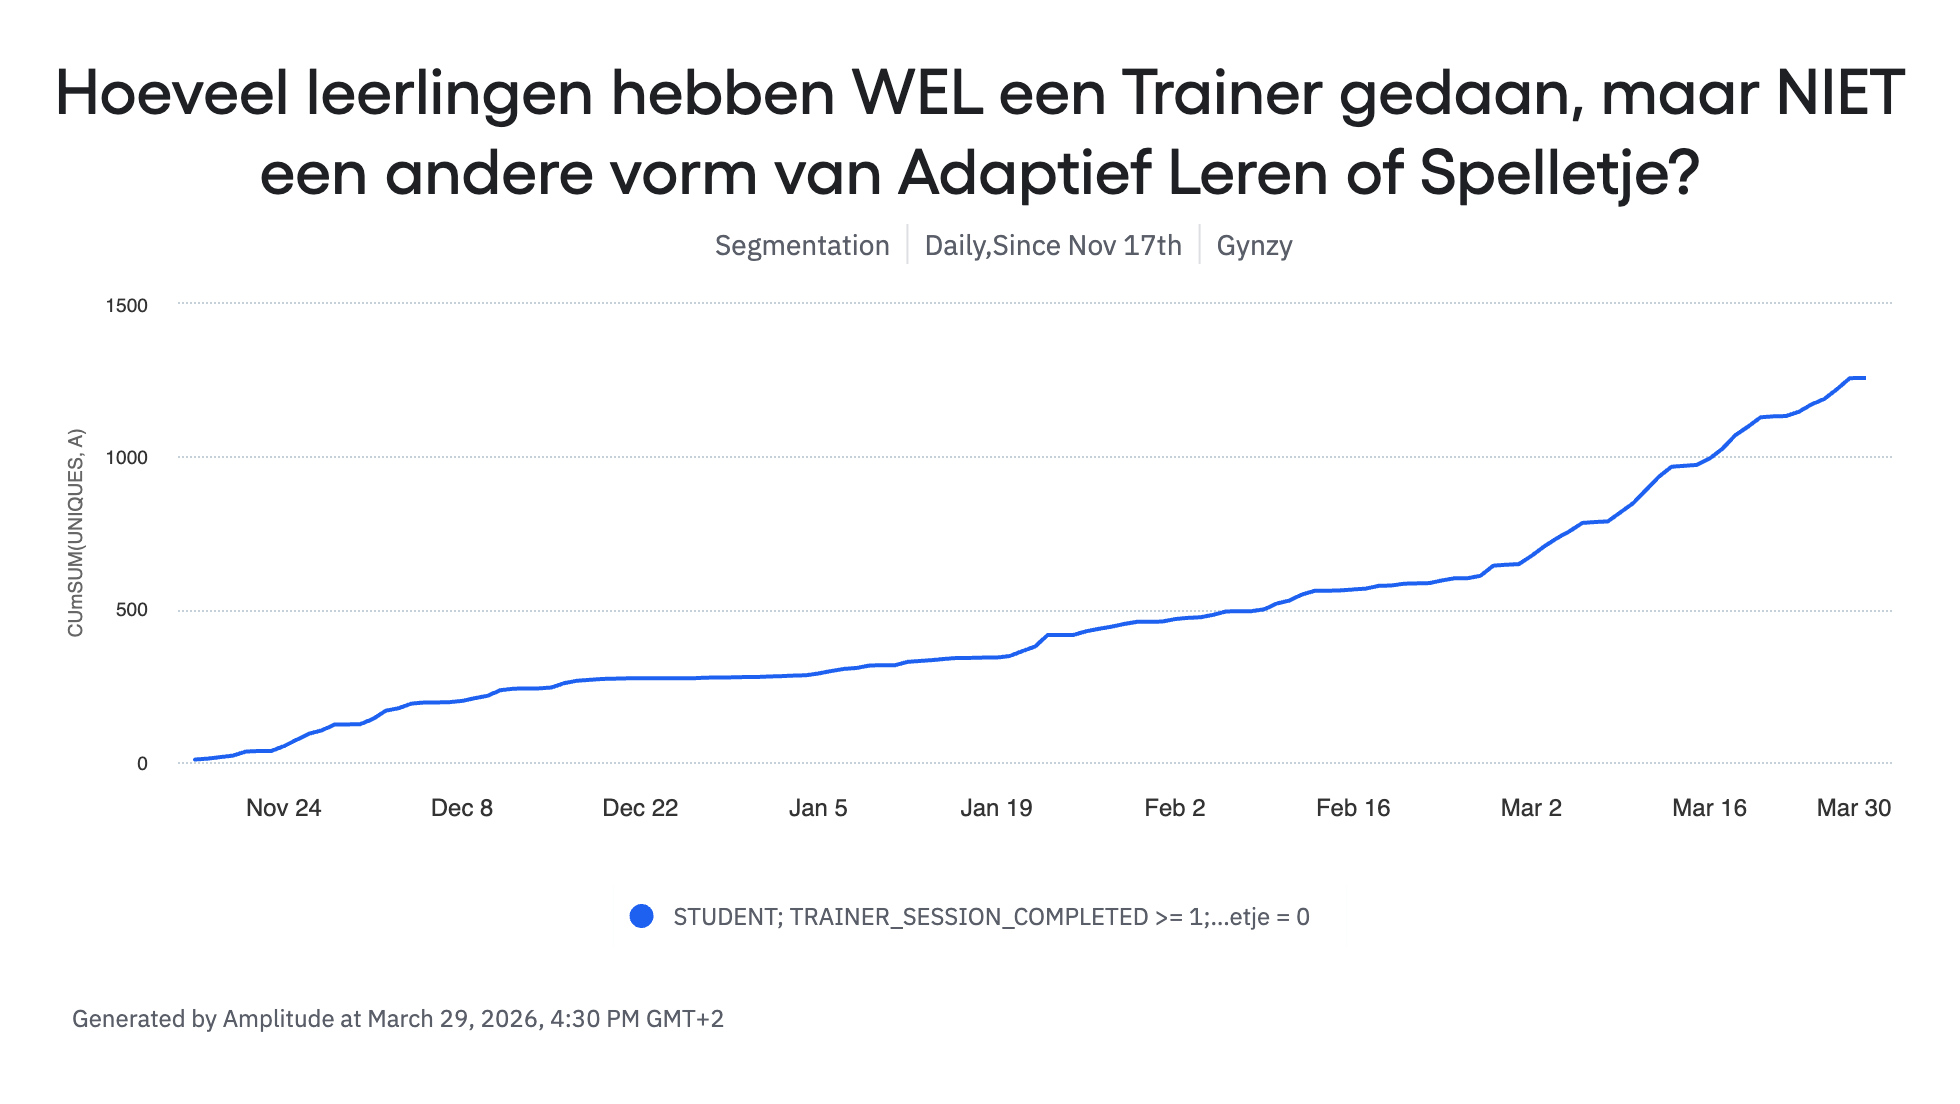
- Over 8,000 students use the Trainer as their only form of independent practice — students we wouldn't have reached otherwise.
- The three trainers prove the scalable setup works: new themes, new interaction types, and new subject areas can be added without rewriting the foundation.
Note: The charts below are based on a 20% sample. The numbers above reflect estimated real-world totals.
Total completed trainer sessions (week over week)
Students using Trainer as their only form of independent practice